
Answer 'how secure are we?' without a week of slides.
One live view of posture across cloud, code, containers and compliance — risk score, top findings, framework coverage and trend — so leadership gets the answer from real data, not a manually assembled deck.
Start with the pressure you're under today.
The answer takes a week to assemble
'How secure are we?' triggers days of exporting and slide-building, and the answer is stale by the time it's presented.
Domains reported in isolation
Cloud, code and compliance are each reported separately, so no one has a single, comparable picture of overall risk.
One platform, mapped to how you actually work.
One live posture view
Overall risk score, risk-by-domain, top findings and compliance coverage on one dashboard, computed from the same data your teams triage.
Trends, not snapshots
Counts, aging and SLA posture trend over live data, so leadership sees direction of travel rather than a point-in-time export.
Board-ready reporting
Generate executive and management reports on demand, mapped to the frameworks the business reports on.
Every finding, risk and control in one place.
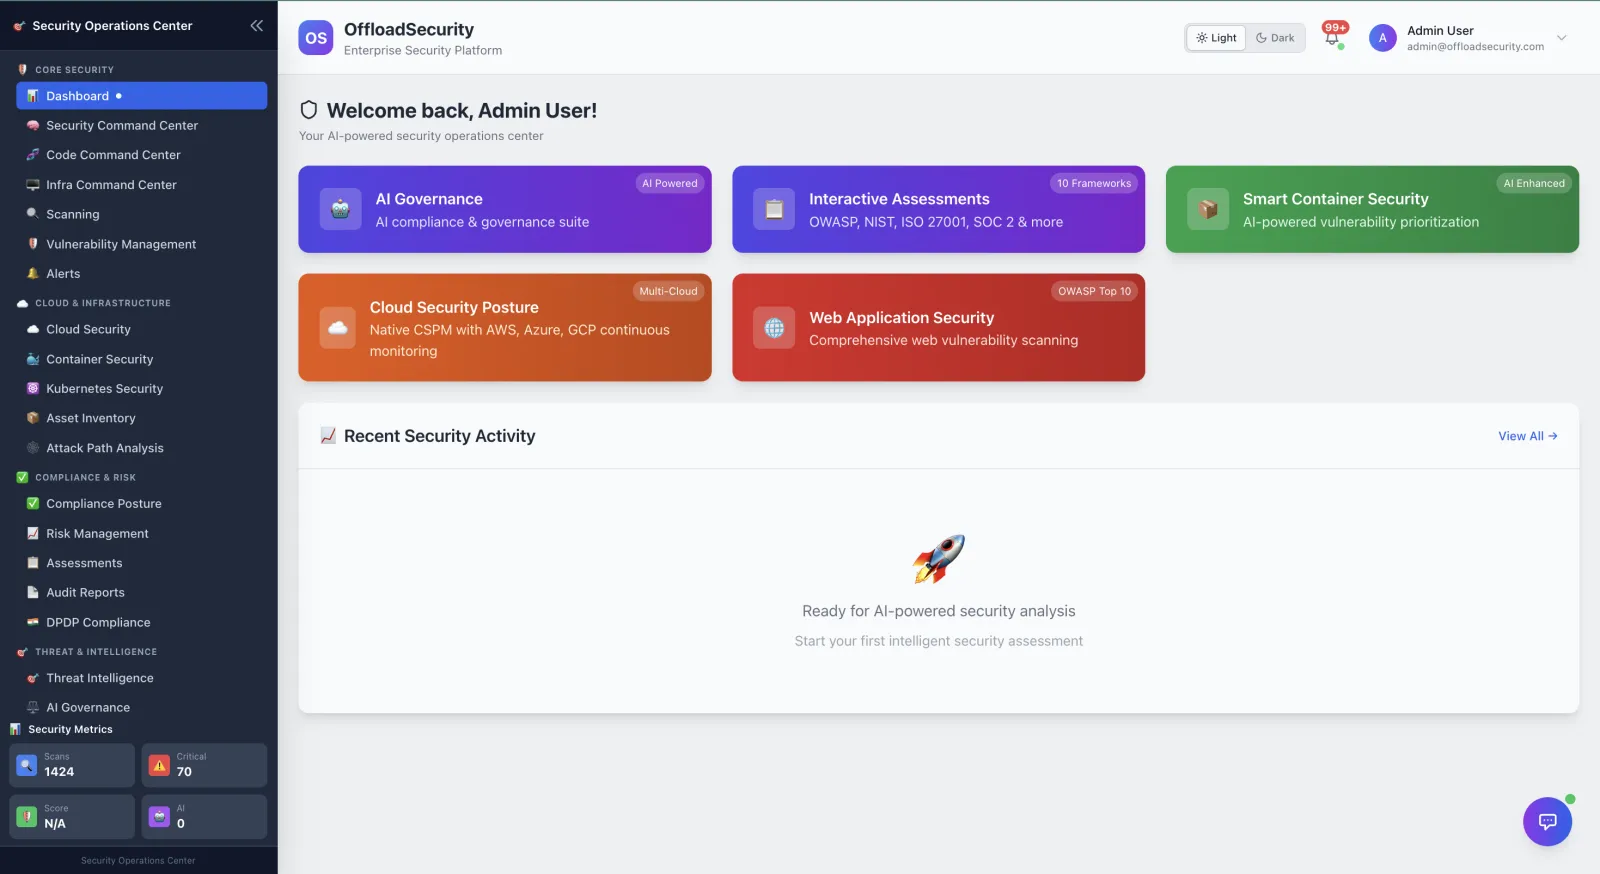
The parts of the platform that carry the load.
What changes with Offload.
- One live posture view across every domain
- Risk trend and SLA posture over real data
- Board-ready reports generated on demand
- The 'how secure are we?' fire drill, gone
See it on your own environment.
Most teams start with a bounded pilot — a few cloud accounts, repositories and clusters, measured against agreed success criteria.